Check out Wisconsin...
From Hot Air.-----------------------------------------------------------------
And the nominees for Least Fiscally Solvent State in America, are…
posted at 5:21 pm on January 14, 2014 by Erika Johnsen
Using 2012 data, the research takes a look at four different indices for measuring states’ solvency, including…
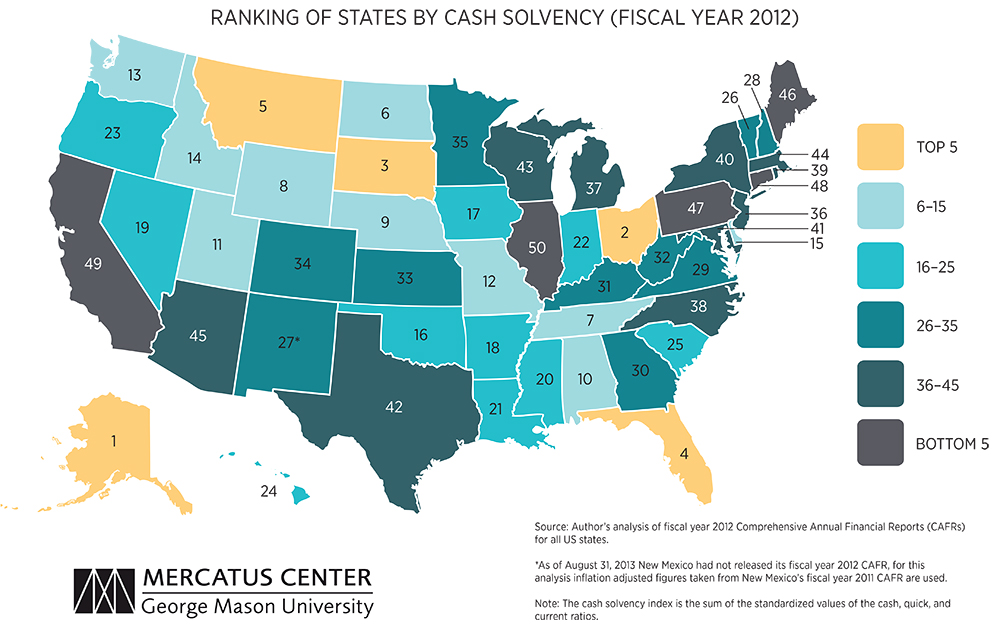
Cash Solvency… as well as long-run solvency (how much a state can use incoming revenue to cover all its expenditures, including long-term obligations like guaranteed pension benefits and infrastructure maintenance) and service-level solvency (whether state governments have enough resources to provide their residents with an adequate level of services). After combining and weighting the four indices to create an overall fiscal-condition index, the five states in the best shape were Alaska, South Dakota, North Dakota, Nebraska, and Wyoming, while the five in the worst shape were California, Massachusetts, Illinois, Connecticut, and New Jersey coming in dead last. (Quite the red vs. blue dichotomy there, eh? Just sayin.’)
A state’s cash solvency takes into account the cash the state can easily access to pay its bills in the near term, reflecting the state government’s liquidity. The map below indicates that most states have enough cash on hand to meet their short-term obligations.
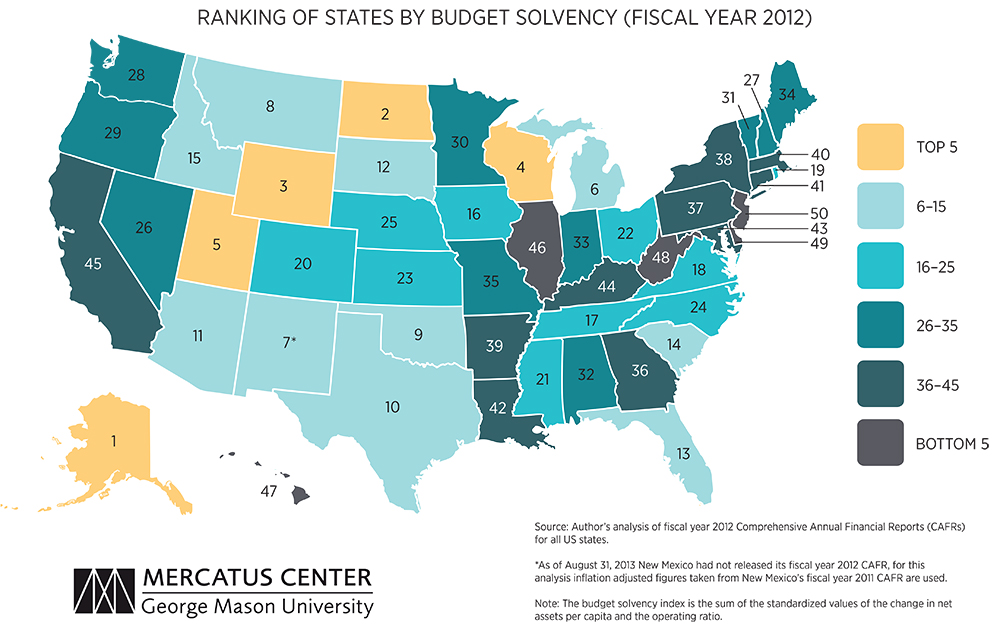
Budget Solvency
A state’s budget solvency is its ability to create enough revenue to cover its expenditures over a fiscal year. Budget solvency varies greatly across states. As the map below shows, in fiscal year 2012-13 states had an operating ratio below 1, indicating a budget deficit.